What is in this article ?
How to install nginx on centos 7
Some of the basics of NGINX as a refresher
Logging, explains that monitoring for errors and access patterns are fundamental to running a server.
Rewrites, covers how rewrites work and also specific implementations of many of the common scenarios. It will be full of specific, practical examples based on real-world scenarios.
Reverse Proxy: Configuring NGINX as a simple reverse proxy
Rate Limit with Nginx
Load Balancing, talks about the load balancing components of NGINX and how to implement them for specific scenarios.
How to install nginx on centos 7
Quite simple, Use the script below
echo "1. install postgresql11-server:"
yum install epel-release -y
yum install nginx -y

echo "2. Enable nginx on start "
systemctl enable nginx

echo "3. Start nginx"
systemctl start nginx

echo "4. Enable firewall for http and https"

firewall-cmd --permanent --zone=public --add-service=http
firewall-cmd --permanent --zone=public --add-service=https
firewall-cmd --reload
# then, you can continue check the status and version
echo "5. Check service status"
service nginx status
netstat -tlpun

echo "6. Check version"
nginx -v

echo "7. Check stub status module"
nginx -V 2>&1 | grep -o with-http_stub_status_module
Result
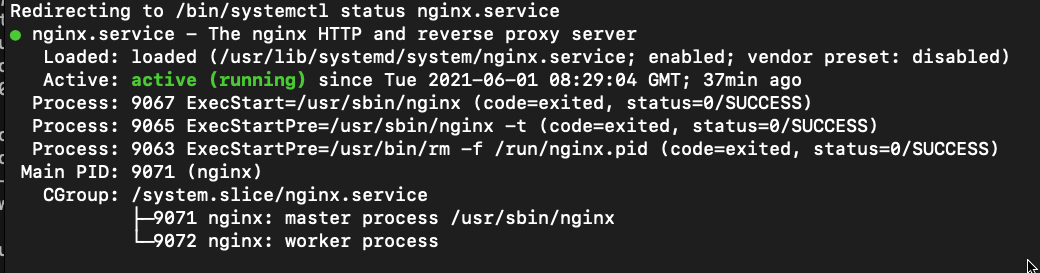
Loging
Here’s our NGINX configuration for local logging:
server {
listen 80;
server_name test.tranhuy.com;
access_log syslog:server=unix:/dev/log;
error_log syslog:server=unix:/dev/log;
location /favicon.ico { access_log off; log_not_found off; }
root /var/www;
}
We can confirm it’s working as expected by viewing the last line in our syslog after accessing the website:
tail -f /var/log/syslog
hoặc
tail -n 1 /var/log/syslog
or
vim /etc/nginx/nginx.conf
#more code by Huy
        access_log /var/log/nginx/access_log combined;
        error_log /var/log/nginx/error_log debug;
        location /nginx_status {
            stub_status on;
            allow 127.0.0.1;
            deny all;
        }
then, try to view the log here
systemctl nginx restart
tail -f /var/log/nginx/access_log
tail -f /var/log/nginx/error_log
or try
curl http://127.0.0.1/nginx_status
Result
Active connections: 1
server accepts handled requests
549 549 21583
Reading: 0 Writing: 1 Waiting: 0
On a Debian / Ubuntu-based system, this will be /var/log/syslog. If you run a RedHat / CentOS-based system, this will be logged to /var/log/messages.
Logging POST data
When we have form submissions, errors in this become difficult to replay and debug if we don’t know the value of the data. By default, NGINX doesn’t log POST data, as it can be very bulky. However, there are certain situations where getting access to this data is vital to debugging issues.
In order to log POST data, we need to define a custom log format:
log_format post_logs ‘[$time_local] “$request” $status ‘
‘$body_bytes_sent “$http_referer” ‘
‘”$http_user_agent” [$request_body]’;
By logging $request_body, we’ll be able to see the contents of a POST submission.
To enable our POST log format, all we need to do is specify the log format for the access logs:
access_log /var/log/nginx/postdata-access.log post_logs;
Configure logging format
It is also possible to log the metrics that you are interested in. To do that, Create a custom log format and just add it in the HTTP section of your NGINX configuration file. The following section defines a custom log format by the name custom_format that can be used in any NGINX server block by specifying its name with access_log directive.
http {
…
…
log_format custom_format ‘$remote_addr – $remote_user [$time_local]”$request” $status $body_bytes_sent “$http_referer” “$http_user_agent” rt=$request_time rt=”$upstream_response_time”‘;
…
…
}
Next add access_log and error_log directive in your specific NGINX virtual host file
# vi your_nginx_virtual_host.conf
server {
…
…
access_log /var/log/nginx/access.log custom_format;
error_log /var/log/nginx/error.log warn;
…
…
}
Check the configuration files for any syntactical error and restart NGINX.
# nginx -t
# systemctl restart nginx
The metrics will be available immediately in the amplify dashboard. Use the tabs at the top of the page to view the metrics that are appropriate for you.
Redirect
Redirecting all calls to HTTPS to secure your site
SSLs help your site more secure
This is especially critical if you’re handling private data or payment information, which could be mandated by law to ensure the transmissions of the data is encrypted.
To ensuring that all calls to your site or application are always encrypted, we need to redirecting all calls to HTTPS
Thankfully, enforcing HTTPS is simple to do.
Now, using two server blocks is the most efficient method:
server {
listen 80;
server_name ssl.tranhuy.com;
return 301 https://ssl.tranhuy.com$request_uri;
}
server {
listen 443 ssl;
server_name ssl.tranhuy.com;
ssl_certificate /etc/ssl/public.pem;
ssl_certificate_key /etc/ssl/private.key;
ssl_protocols TLSv1 TLSv1.1 TLSv1.2;
ssl_ciphers HIGH:!aNULL:!MD5;
access_log /var/log/nginx/ssl-access.log combined;
location / {
root /var/www;
index index.html index.htm;
}
}
Reverse Proxy: Configuring NGINX as a simple reverse proxy
One of the most powerful features of NGINX is its ability to act as a reverse proxy. As opposed to a forward proxy, which sits between the client and the internet, a reverse proxy sits between a server and the internet.
Here’s a visual representation:
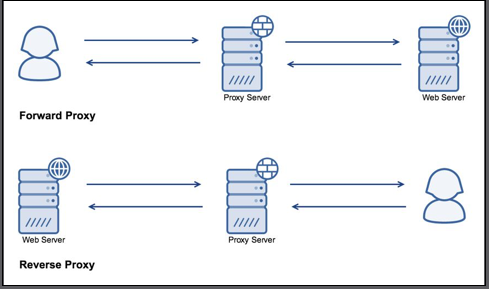
A reverse proxy can provide a multitude of features. It can load balance requests, cache content, rate limit, provide an interface to a Web Application Firewall (WAF), and lots more. Basically, you can greatly increase the number of features available to your system by running it through an advanced reverse proxy
Here’s our server block directive to proxy all requests through to port 8000 on the localhost:
server {
listen 80;
server_name proxy.tranhuy.com;
access_log /var/log/nginx/proxy-access.log combined;
location / {
proxy_pass http://127.0.0.1:8000;
}
}
Rate limiting with nginx
If you have an application or site where there’s a login or you want to ensure fair use between different clients, rate limiting can help to help protect your system from being overloaded.
By limiting the number of requests (done per IP with NGINX), we lower the peak resource usage of the system, as well as limit the effectiveness of attacks which are attempting to brute force your authentication system.
Follow these steps for rate limiting:
1. Firstly, we need to define a shared memory space to use for tracking the IP addresses. This needs to be added in the main configuration file, outside the standard server block directive. Here’s our code:
limit_req_zone $binary_remote_addr zone=basiclimit:10m rate=10r/s;
2. Then, within the server block, you can set which location you wish to limit. Here’s what our server block directive looks like:
server {
listen 80;
server_name limit.tranhuy.com;
access_log /var/log/nginx/limit-access.log combined;
location / {
limit_req zone=basiclimit burst=5;
proxy_pass http://127.0.0.1:8000;
proxy_set_header X-Forwarded-For
$proxy_add_x_forwarded_for;
proxy_set_header X-Real-IP $remote_addr;
proxy_set_header Host $host;
}
}
We can run Apache Benchmark (a simple web benchmarking tool) under a few different scenarios to test the effectiveness. The first is to use a single connection and make 200 requests:
“ ab -c 1 -n 200 http://limit.tranhuy.com/
This gives us the following results:
Concurrency Level: 1
Time taken for tests: 20.048 seconds
Complete requests: 200
Failed requests: 0
Total transferred: 5535400 bytes
HTML transferred: 5464000 bytes
Requests per second: 9.98 [#/sec] (mean)
Time per request: 100.240 [ms] (mean)
Time per request: 100.240 [ms] (mean, across all concurrent
requests)
Transfer rate: 269.64 [Kbytes/sec] received
As the results show, we didn’t receive any errors and averaged 9.98 requests per second.
In the next test, we’ll increase the number of concurrent requests to 4 at a time:
ab -c 4 -n 200 http://limit.tranhuy.com/
This gives us the following results:
Concurrency Level: 4
Time taken for tests: 20.012 seconds
Complete requests: 200
Failed requests: 0
Total transferred: 5535400 bytes
HTML transferred: 5464000 bytes
Requests per second: 9.99 [#/sec] (mean)
Time per request: 400.240 [ms] (mean)
Time per request: 100.060 [ms] (mean, across all concurrent
requests)
Transfer rate: 270.12 [Kbytes/sec] received
Even with the increased request rate, we still received responses at a rate of 10 requests per second.
Load Balancing
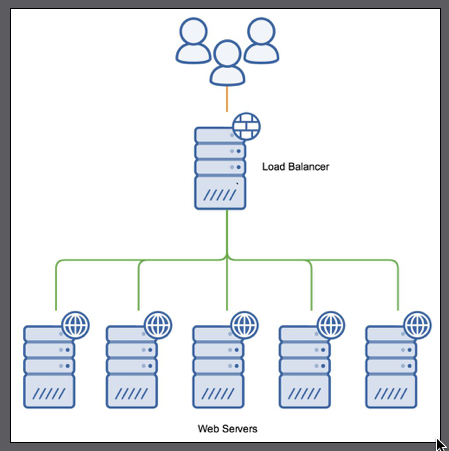
The three scheduling algorithms which NGINX supports are round-robin, least connections, and hashing.
Round-robin load balancing : distribute requests across the servers in a sequential basis; the first request goes to the first server, the second request to the second server, and so on
Least connected load balancing : NGINX distributes the requests to the servers with the least amount of active connections. This provides a very rudimentary level of load-based distribution; however, it’s based on connections rather than actual server load.
Hash-based load balancing : uses a key to determine how to map the request with one of the upstream servers. Generally, this is set to the client’s IP address, which allows you to map the requests to the same upstream server each time.
## Reference
https://www.digitalocean.com/community/tutorials/how-to-install-the-apache-web-server-on-ubuntu-18-04
Bài viết khác

Use AWS to deploy your applications and services
Amazon Web Services (AWS) is a cloud computing platform that provides a wide range of services to help businesses and individuals build and deploy applications in the cloud. AWS offers a variety of services such as compute, storage, databases, networking, security, and more. In this guide, we will walk through the steps to get started […]
Use docker to run go project
Docker is a powerful tool that enables developers to create, deploy and run applications in a containerized environment. Using Docker to run Go projects has many advantages, including the ability to isolate your application from the underlying operating system, simplifying the deployment process, and allowing for greater scalability and flexibility. In this guide, we will […]
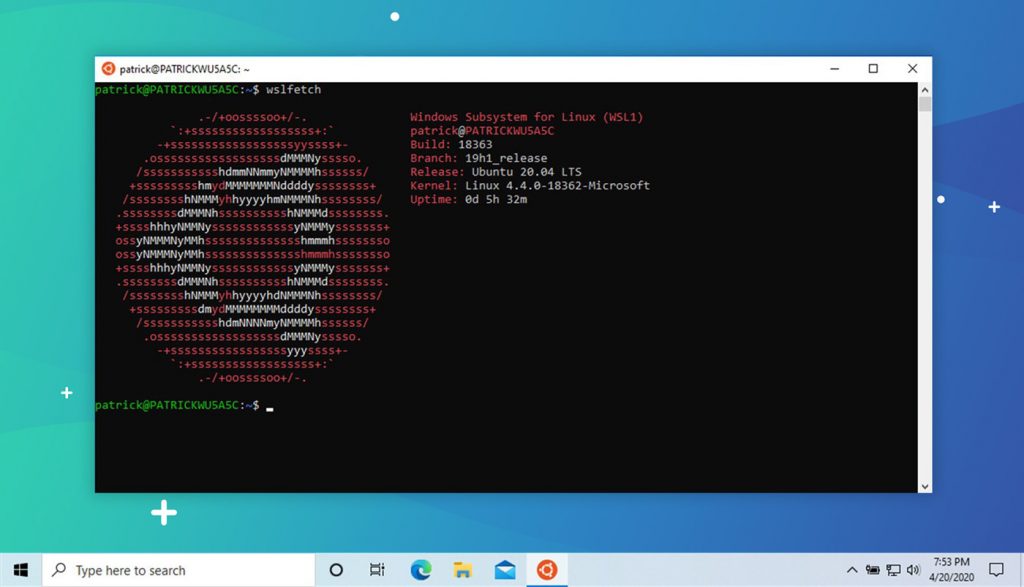
Install WSL for windows 10
1/ Enable feature Windows Subsystem for Linux Head to Control Panel > Programs > Turn Windows Features On Or Off. Enable the “Windows Subsystem for Linux” option in the list, and then click the “OK” button. Restart computer Now you can type on console: wsl –help 2/ Download ubuntu 18 from Microsoft Store or open […]
Make a binary file or script file run on startup on ubuntu
To make a binary file run on boot, you can create a startup script that will run the binary file when the operating system starts. The exact process for creating a startup script depends on the operating system you’re using. Here’s an example for a Linux operating system using the systemd init system: Create a […]

Explicit ssl bumping with Squid
To perform explicit SSL bumping with Squid, you need to perform the following steps: Generate a SSL certificate and key: You can either generate a self-signed certificate or obtain one from a certificate authority. The certificate and key will be used by Squid to encrypt and decrypt the traffic. Install and configure Squid: Squid is […]

Explicit ssl bumping with HAProxy
Basic guide About Explicit SSL bumping Explicit SSL bumping also known as “SSL interception,” is a feature of some reverse proxies and security appliances that allows the proxy to decrypt, inspect, and re-encrypt SSL/TLS encrypted traffic. The proxy acts as a man-in-the-middle, decrypting incoming SSL/TLS traffic and re-encrypting it before forwarding it to the destination […]


 Khoá học lập trình game con rắn cho trẻ em