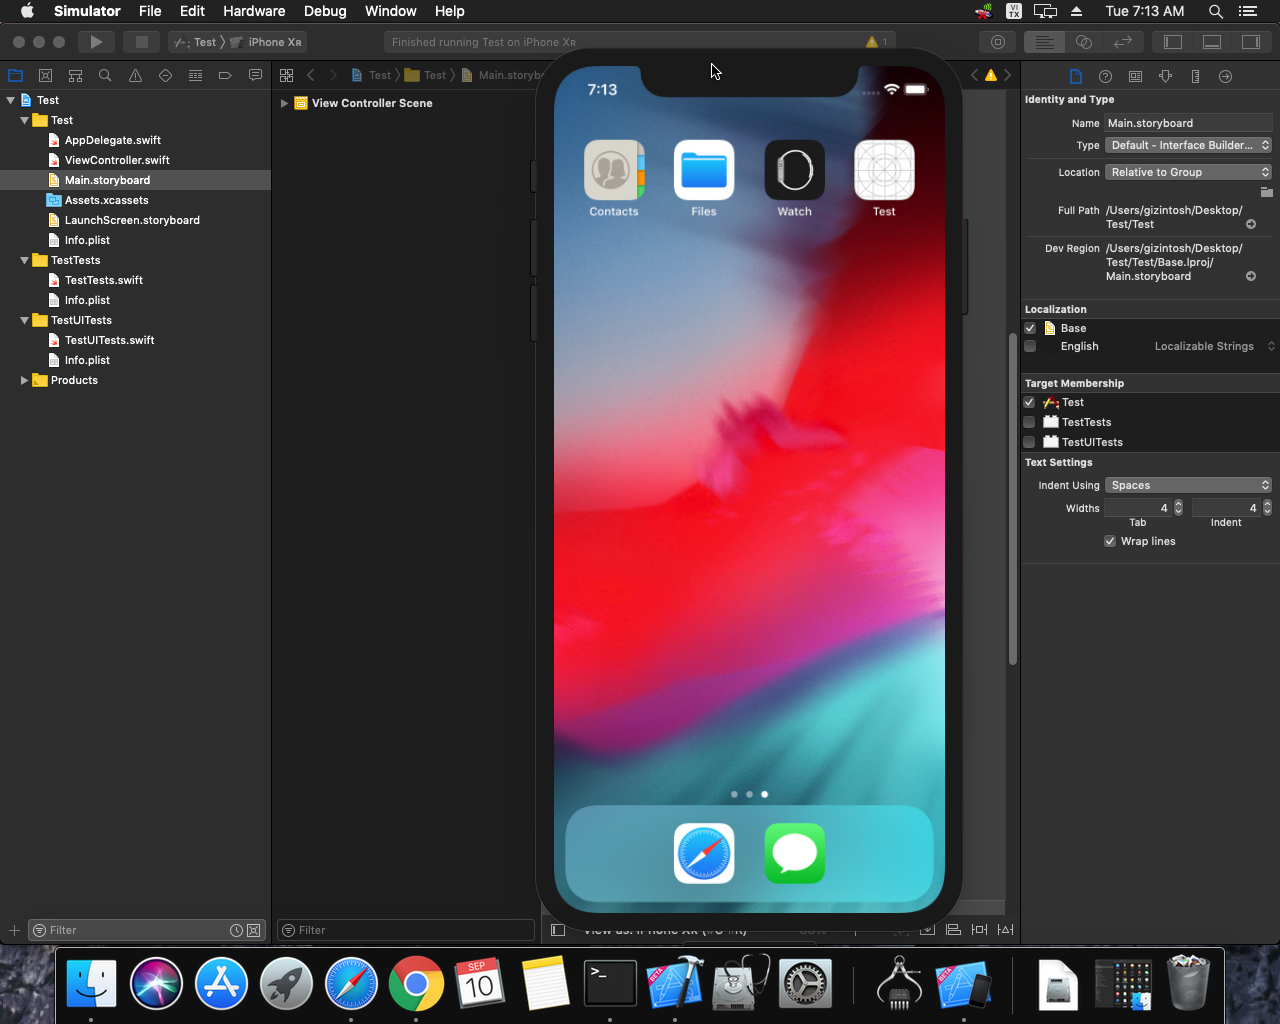
Find View in View Hierachi
Memory usage graph
Memory leak debug with Xcode Instruments
What is Xcode Instruments?
Xcode Instruments is best described as a powerful and flexible performance-analysis and testing tool. It’s part of the Xcode toolset which also includes tools like Create ML and the Accessibility Inspector.
The instruments can be used to:
Track down problems in your source code
Analyze the performance of your app
Find memory problems
And a lot more!
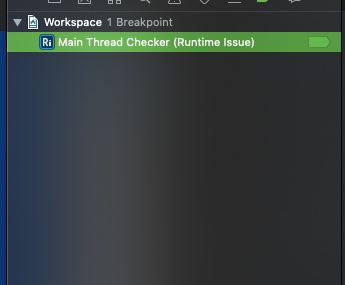
Main Thread Checker in Xcode
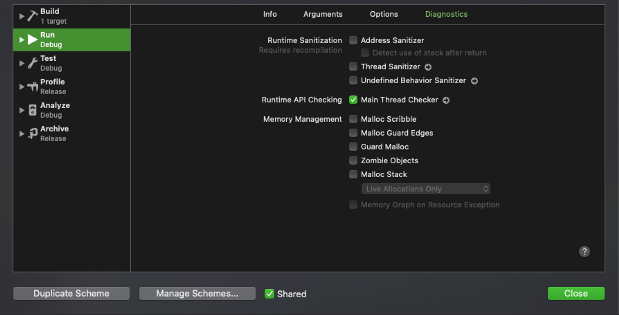
How to enable Main Thread Checker ?
Edit scheme.
Select run scheme.
Select the Diagnostics tab.
Check the Main Thread Checker Check Box.
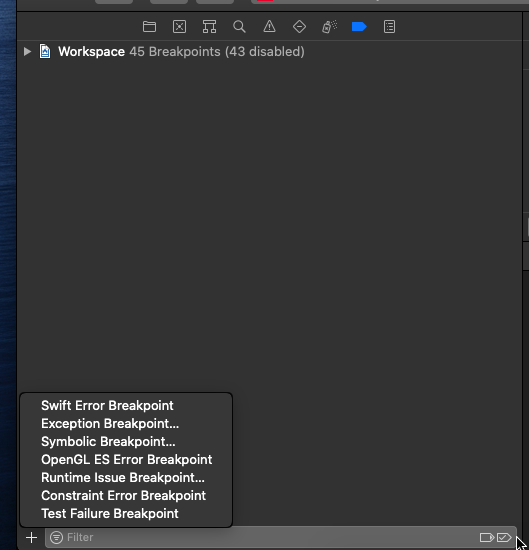
Click on small arrow written besides MTC text (Optional).
On click on arrow message besides main thread checker will add breakpoint for the project for debugging.
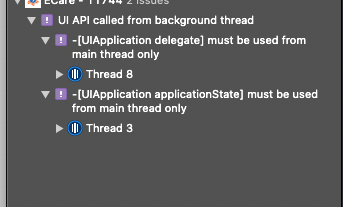
How does this function works ?
During runtime it will check if all UI and other code which should be run in main thread is working or not, incase it is not working it will pause at the line of code which should be put in main thread along with appropriate warning message.
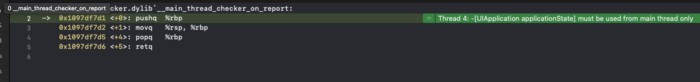
If main thread debugger break point is not added and one wish to identify issues without that then you can get a look at the list of all the main thread issues in runtime error messages.
References
https://www.hackingwithswift.com/read/9/4/back-to-the-main-thread-dispatchqueuemain
Bài viết khác
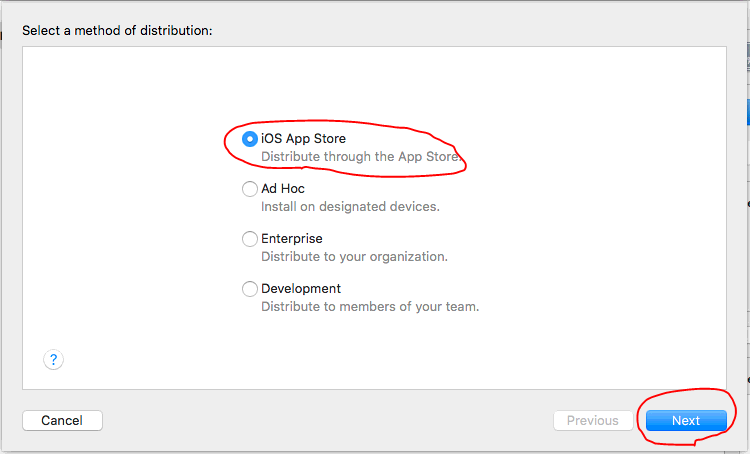
How to create your own install-on-air service for installing ios application
To upload your IPA file to your own server, you can follow these steps: Create a web server: You’ll need a web server to host your IPA file. You can either set up a physical server or use a cloud-based server provider such as Amazon Web Services (AWS) or Google Cloud Platform (GCP). Upload the […]

RxSwift for ios and swift developer
RxSwift is a powerful tool for iOS and Swift developers that allows you to write cleaner and more maintainable code by leveraging the power of reactive programming. In this article, we will take a look at what reactive programming is, and how you can get started with using RxSwift in your own projects. What is […]
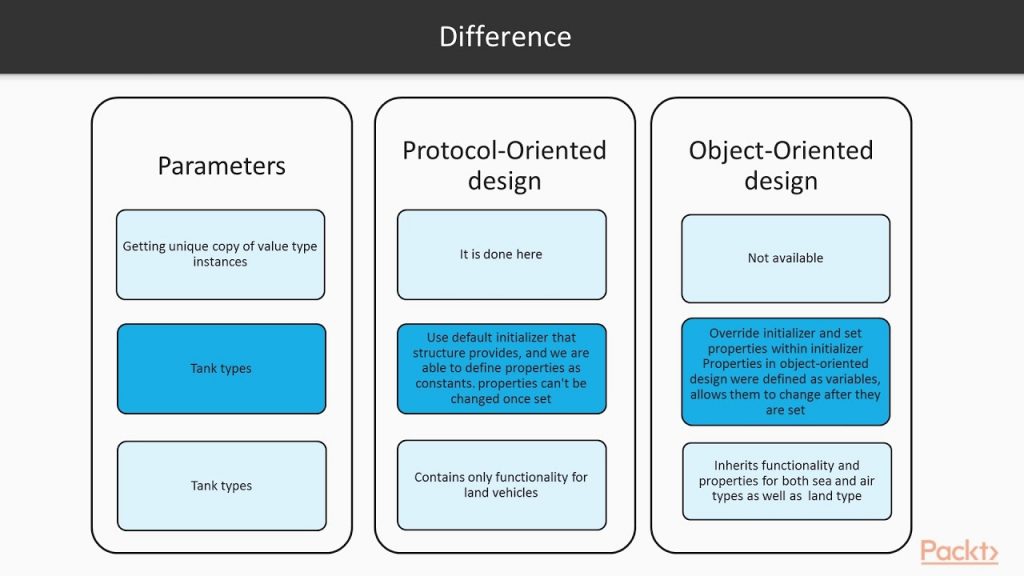
Basic concepts of Protocol-Oriented Programming (POP) in swift and ios developer
Protocol-Oriented Programming (POP) is a programming paradigm introduced in Swift that emphasizes the use of protocols as a way to define and enforce common behavior for multiple types. POP is a powerful tool for designing and organizing code, and can be used to achieve many of the same goals as object-oriented programming, but with greater […]
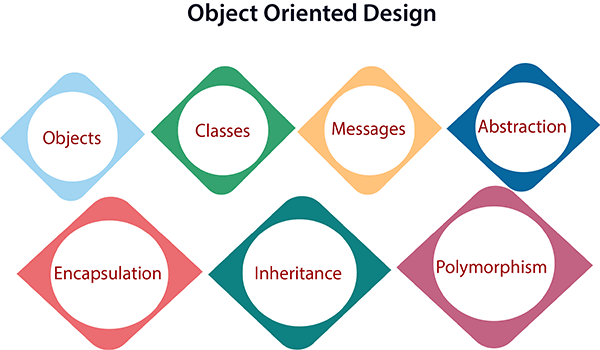
Basic concepts of Object-Oriented Design (OOD)
Object-Oriented Design (OOD) is a software design paradigm that emphasizes the use of objects and classes to represent real-world entities and their behavior. OOD is based on the idea that software systems can be modeled as a collection of objects that interact with each other to achieve a common goal. The following are some of […]
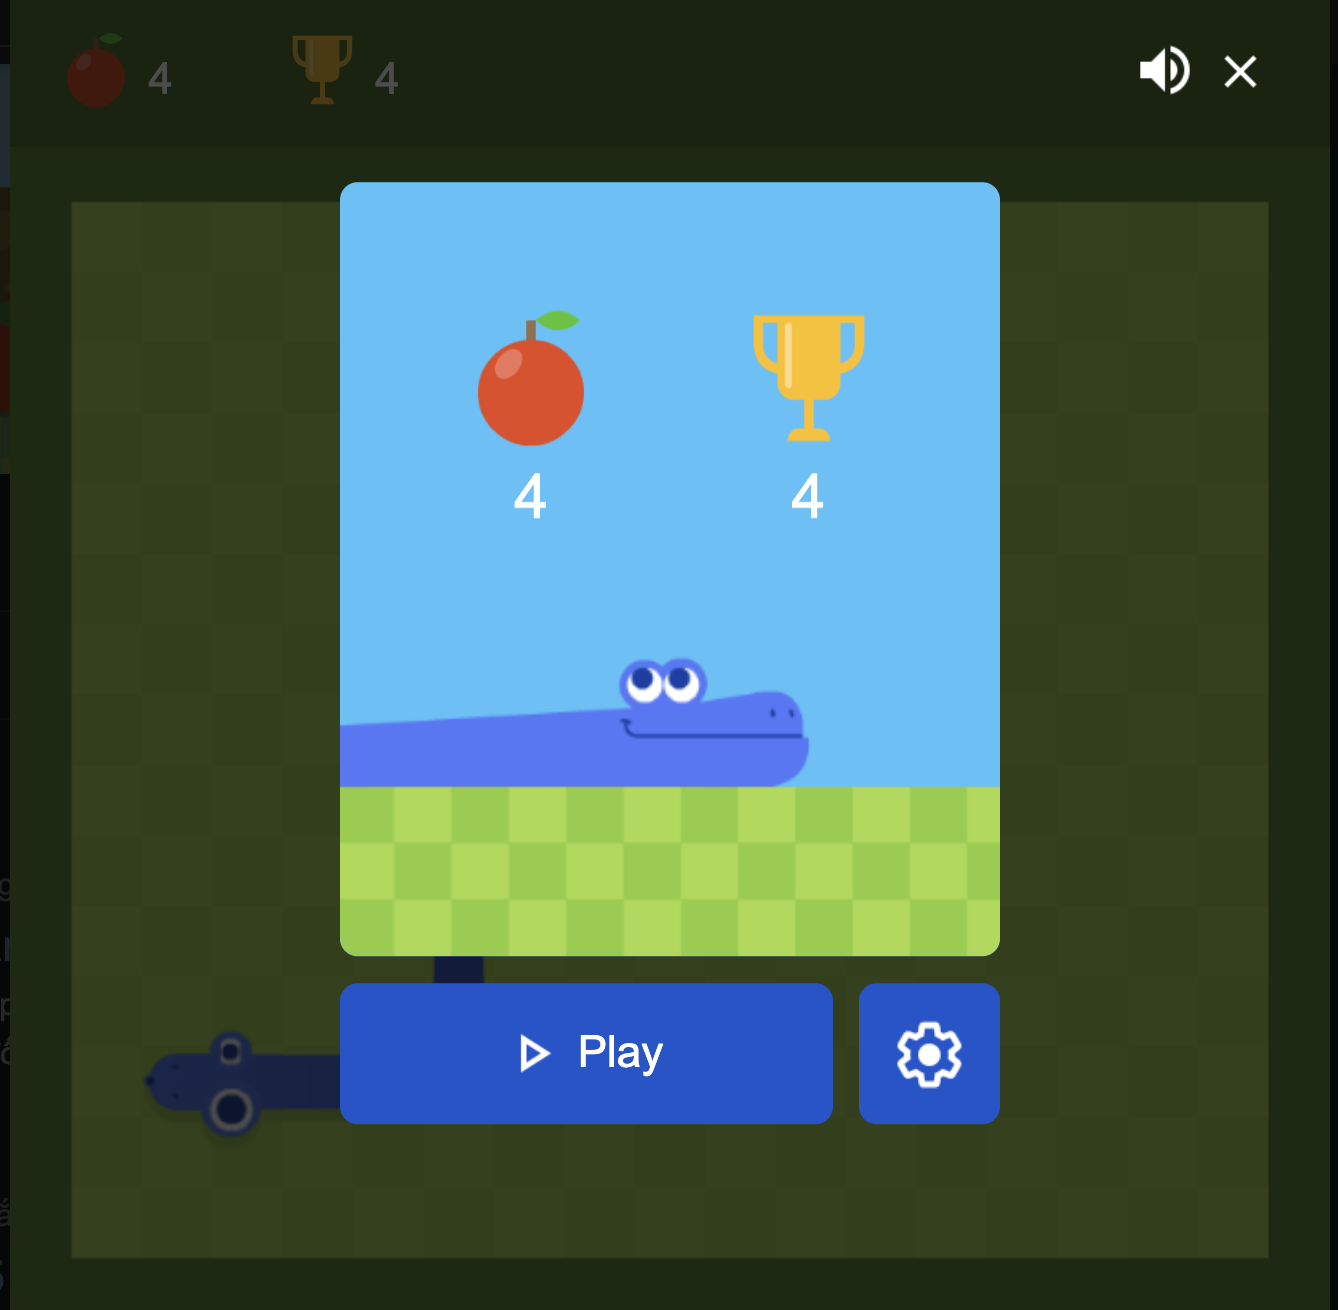 Khoá học lập trình game con rắn cho trẻ em